By now, you have probably come across the phrase “content is king” when researching strategies for inbound marketing. While this phrase is true in today’s digital-centric world, content production is too often associated with the process of developing copy, when in fact, visual content may play an even bigger role in attracting potential customers to your website.
For example, let’s assume you are on Facebook. Think about how you engage with content that comes across your news feed daily. You are probably engaging mostly with content that catches your eye from a visual standpoint – be it video or infographics – then reading the caption copy for more information or validation for what you just saw. And if it’s branded content, you are probably taking an additional step to check out the brand’s website, in which you have just begun the research phase of the customer journey.
If you take a look at research related to consumer behavior and visual communications, you are likely to come across the 80/20 concept: people retain 80% of what they see and only 20% of what they read. This makes sense considering that people process visuals 600,000 times faster than text and 90% of information sent to the brain is primarily visual.
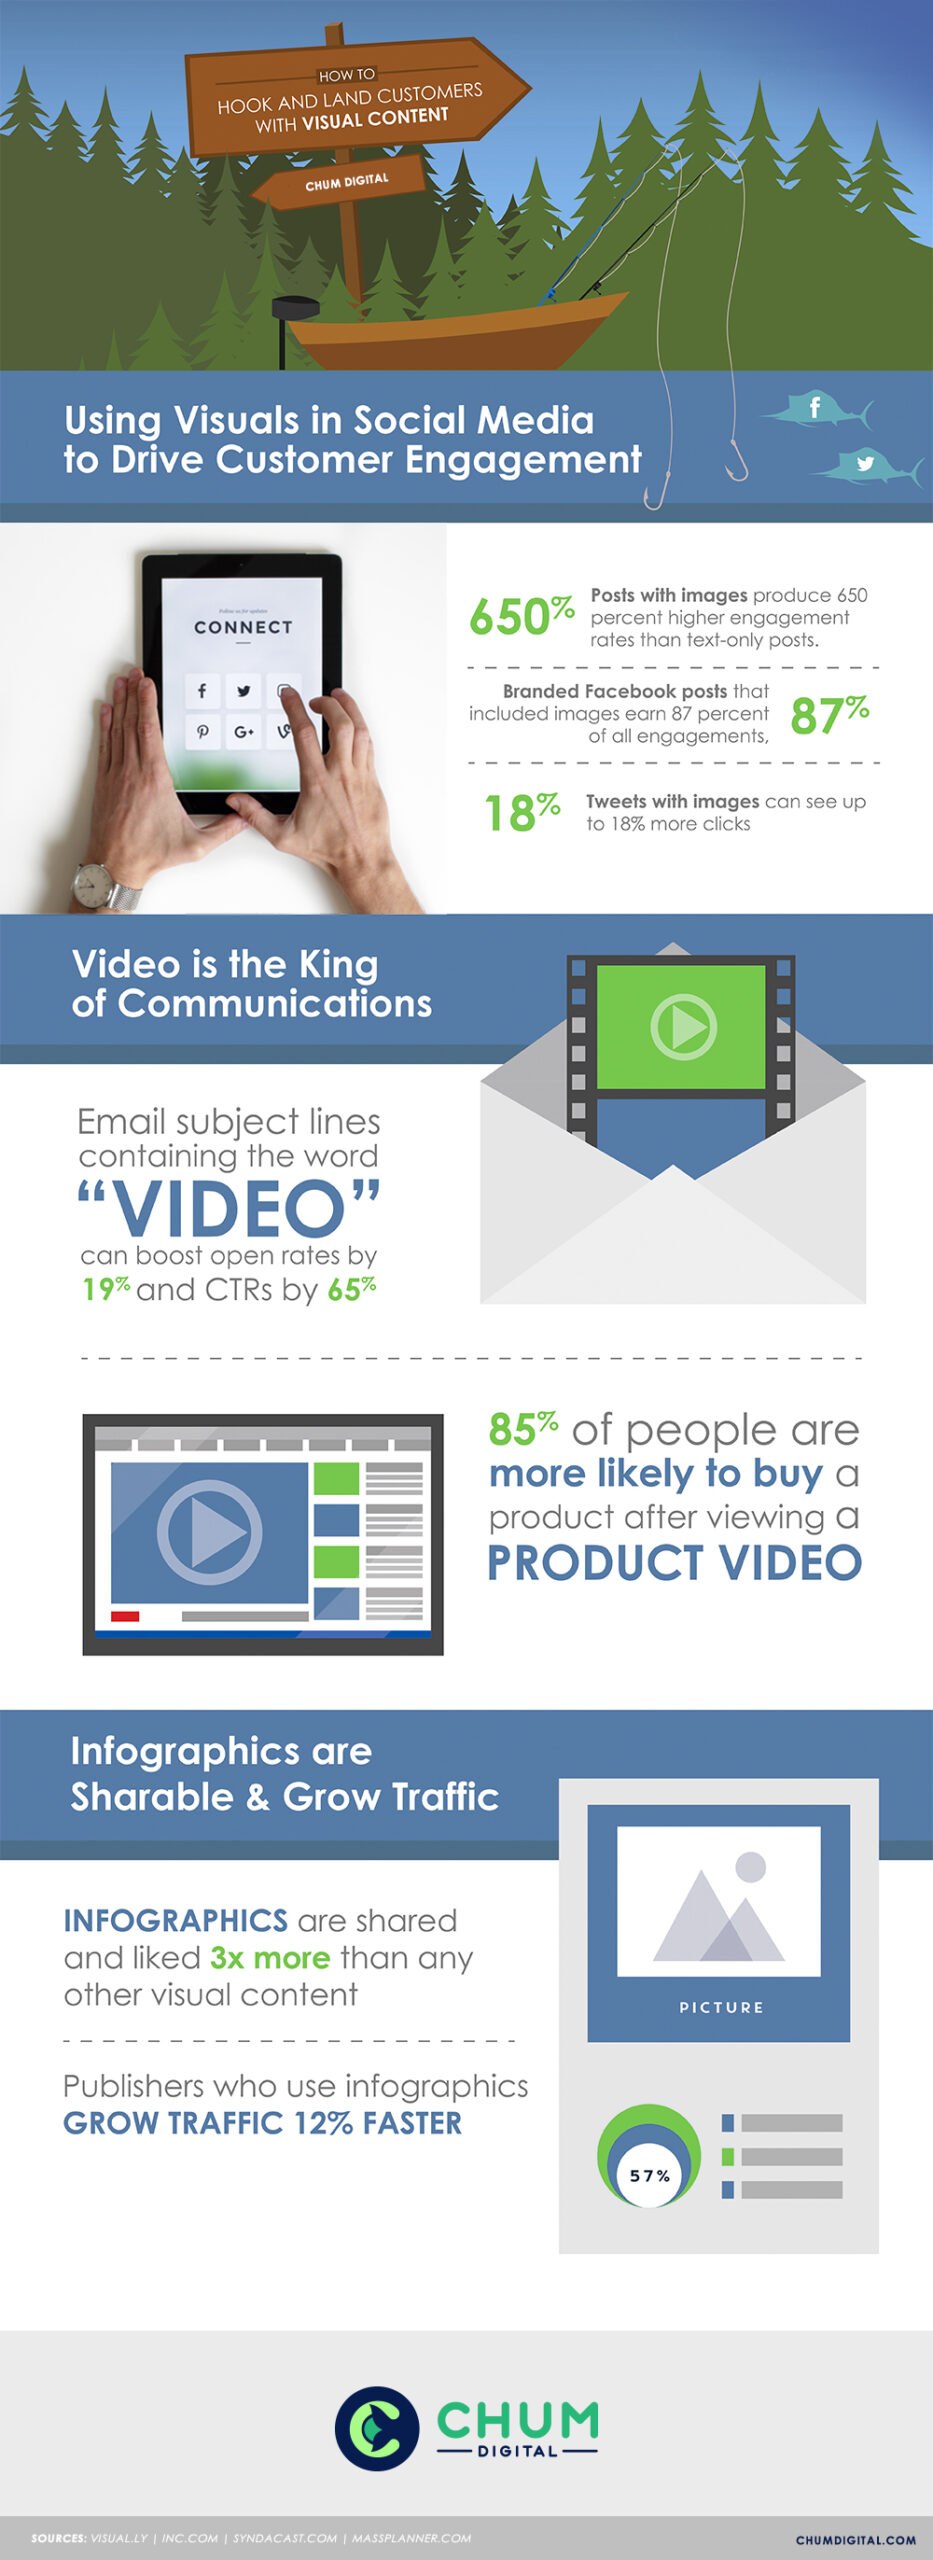
At this point, you are probably thinking to yourself that it’s ironic that you are reading a post about the importance of visual communications (don’t worry, there’s an infographic below). The fact is, in marketing and many other disciplines, visuals and copy must work in tandem to communicate a message effectively. And often, one can’t exist without the other.
Producing the perfect combination of visual and written content are important factors in any inbound marketing strategy, but pay close attention to your visual content metrics – you may be sitting on a lead generation goldmine.
Below are some important statistics to keep in mind as you continue to integrate visual content into your inbound marketing strategy:


